
10 Frameworks for Stress-Testing Your Startup Idea
42% of startups fail because they build products no one wants. This guide is your toolkit to avoid that mistake. It covers 10 frameworks designed to stress-test your startup idea, helping you uncover weaknesses before investing time and money. These methods focus on critical areas like market demand, customer behavior, scalability, and profitability.
Key Frameworks to Test Your Idea:
- Lean Canvas: Identify and rank assumptions, then validate them through experiments.
- Business Model Canvas: Break down your business into 9 components and test each one.
- SWOT Analysis: Assess strengths, weaknesses, opportunities, and threats.
- Porter’s Five Forces: Analyze external market forces shaping your industry.
- TAM, SAM, SOM: Quantify your market size and determine realistic revenue potential.
- Problem-Solution Fit: Use customer interviews to confirm the problem is real and urgent.
- Smoke Test: Test demand with landing pages and price signals before building.
- Unit Economics: Ensure your customer acquisition costs (CAC) are sustainable.
- Risk Matrix: Map out and test critical assumptions to avoid blind spots.
- Idea Scoring: Evaluate your idea across 5 dimensions to decide whether to proceed.
Quick Tip:
Start small - use simple tests like landing pages or interviews. Only scale up once you’ve validated the basics. This structured approach reduces risk and increases your chances of success in today’s competitive startup landscape.
::: @figure 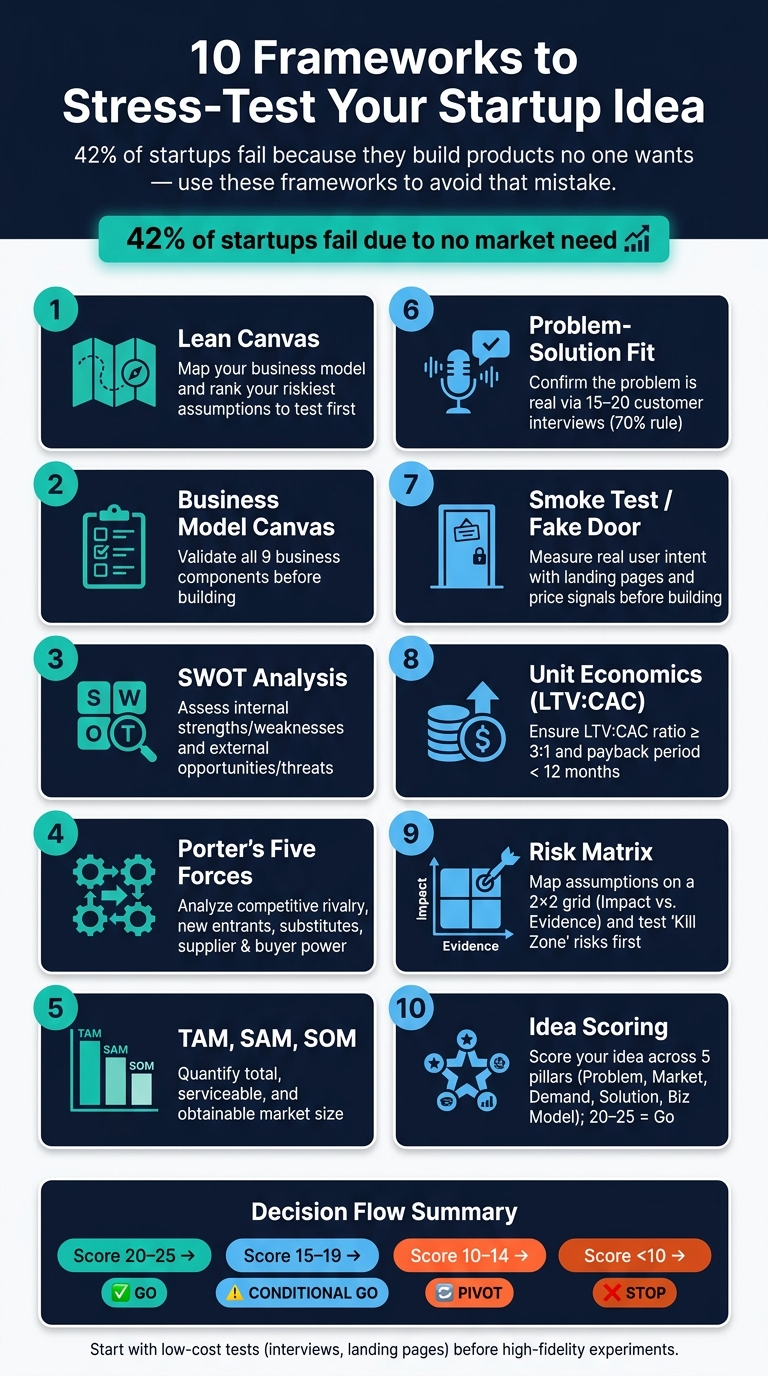 {10 Frameworks to Stress-Test Your Startup Idea}
:::
{10 Frameworks to Stress-Test Your Startup Idea}
:::
Build a Winning Startup Idea with a Proven Framework
::: @iframe https://www.youtube.com/embed/AC8X1dPZKdI :::
1. Lean Canvas Framework
The Lean Canvas is a one-page tool designed to map out your entire business model. Developed by Ash Maurya, it’s tailored for early-stage startups navigating uncertainty, rather than established businesses with proven strategies. Its strength lies in uncovering and prioritizing your assumptions.
Each completed canvas reveals 15–30 hidden assumptions [6]. The framework helps identify and rank these assumptions by risk. Maurya refers to these as "Riskiest Assumptions to Test" (RATs) - the beliefs with the highest potential impact and uncertainty. These are the areas that could make or break your startup if left unaddressed.
The order in which you complete the Lean Canvas matters. Start with Customer Segments to anchor your analysis. Avoid the common mistake of beginning with your solution. Follow this sequence: Customer Segments → Problem → Unique Value Proposition (UVP) → Solution → Channels → Revenue/Costs → Key Metrics → Unfair Advantage.
"The solution should be a consequence of understanding the customer, not the starting point." - LeanPivot.ai [6]
Be specific when defining your early adopters. Instead of vague categories like "SMBs", identify a clear niche, such as "solo agency owners managing 5–15 client projects." Use a separate canvas for each customer segment, as combining them can obscure critical risks. After drafting your canvas, use a 2x2 matrix (Uncertainty vs. Impact) to pinpoint the assumptions in the top-right quadrant - those are your priority experiments.
To validate each section of the canvas, pair it with a tangible test. For example, customer interviews (aim for 10–15) can confirm whether the problem you’ve identified is real. A strong signal is when 7 out of 10 interviewees describe the pain without being prompted [9]. To test your UVP, a landing page with a "5-second test" should result in 3–5% click-through to pricing from qualified visitors [8]. Revenue validation is strongest when customers commit financially, such as through pre-sales or refundable deposits - even a $49 deposit carries more weight than survey responses.
| Lean Canvas Section | Validation Method | Success Signal |
|---|---|---|
| Problem | Customer interviews | 7/10 confirm the pain unprompted [9] |
| UVP | Landing page / 5-second test | 3–5% click-through to pricing [8] |
| Solution | Concierge MVP or demo video | 40–60% reach "first value" within 7 days [8] |
| Revenue | Pre-sales or deposits | 1–2% purchase or deposit rate [8] |
| Key Metrics | AARRR framework | 10–25% trial-to-paid conversion [8] |
Startups that rigorously apply the Lean Canvas approach can reach the market up to 40% faster than those relying on traditional business plans [7]. This speed advantage comes from avoiding wasted effort on building products no one wants. For a deeper dive into testing your business model, consider exploring the Business Model Canvas next.
2. Business Model Canvas Framework
The Business Model Canvas (BMC), developed by Alexander Osterwalder, helps shift your focus from initial uncertainty to practical execution. It breaks your business into nine core components: Customer Segments, Value Propositions, Channels, Customer Relationships, Revenue Streams, Key Resources, Key Activities, Key Partnerships, and Cost Structure. Each block represents a hypothesis that needs to be validated. This structured approach not only visualizes your business model but also prepares you for rigorous testing.
Why is this so important? Because a staggering 35% of startups fail due to a lack of market demand for their product [9]. The BMC forces you to confront this risk early - before you pour resources into development.
Start by reexamining the customer-facing elements. Are you solving a real problem for a defined audience? Ask yourself, Who are we creating value for, and why would they choose us over alternatives? Once you're confident in these answers, then move on to operational aspects like Key Resources, Key Activities, and Key Partnerships. A common mistake is building out infrastructure too soon - before confirming that customers exist and care about your offering.
"Validation isn't about killing your idea. It's about testing your assumptions before the market does." - Sarah Moradi, Business Instructor [9]
When your canvas is ready, highlight the areas with the weakest evidence. These are your riskiest assumptions - often found in Customer Segments and Value Propositions. To test these, run small, low-cost experiments. For example:
- Conduct 10–15 customer interviews with people outside your immediate network.
- Create a simple landing page with a clear call-to-action (e.g., "Sign Up").
- Try a concierge MVP, where you manually deliver the service to gauge interest.
Set measurable thresholds for success - such as a 15% click-through rate on your landing page - so you're not tempted to justify weak results [4][11]. Treat the canvas as a dynamic tool. Update it whenever market feedback, channel performance, or cost structures change.
Here’s a quick reference table to stress-test each BMC component and avoid common pitfalls:
| Building Block | Core Stress-Test Question | Common Mistake |
|---|---|---|
| Customer Segments | Who are you creating value for? | Listing demographics instead of needs-based segments [10] |
| Value Propositions | Why should customers choose you? | Focusing on features instead of customer outcomes [10] |
| Channels | How do you reach and deliver value? | Overlooking post-purchase support channels [10] |
| Revenue Streams | How much are they willing to pay? | Ignoring additional revenue opportunities [10] |
| Cost Structure | What are the major costs in the model? | Underestimating customer acquisition costs (CAC) [10] |
3. SWOT Analysis Framework
SWOT Analysis breaks down your startup idea into four key areas: Strengths, Weaknesses, Opportunities, and Threats. The first two focus on internal factors you can control, like your team, technology, or available capital. The latter two examine external influences, such as regulations, market competition, or changing consumer trends [12]. This framework encourages you to identify and address potential risks by analyzing both internal and external aspects with equal attention. The insights gained can then guide you in crafting strategic plans using tools like the TOWS Matrix.
When filling out each quadrant, aim for specificity. For example, instead of listing "passion" as a strength, highlight something concrete like "Co-founder has a decade of supply chain experience." Similarly, when identifying threats, consider data like this: 40% of fintech startups fail validation because they fail to address government regulations [4]. If your idea involves fintech or cybersecurity, it’s smart to conduct a regulatory smoke test early. This could mean consulting a compliance expert or submitting a mock filing before moving further into development.
Once your SWOT grid is complete, take it a step further with a TOWS Matrix. This tool helps you cross-analyze the four areas, connecting strengths to opportunities and strategizing ways to counter threats. This turns your analysis into actionable strategies [12]. To deepen your evaluation, consider using a Go/No-Go Scorecard. Rate your idea on a scale of 1–5 across categories like Market Need, Competition, and Financial Feasibility. If your total score is below 20, it might be time to rethink your approach before moving forward [14].
| SWOT Component | Key Stress-Test Question |
|---|---|
| Strengths | What unique advantage do we have that competitors can't easily replicate? |
| Weaknesses | What gaps in our team, capital, or resources could derail this idea? |
| Opportunities | What recent shift in technology or consumer behavior makes this the right time for our idea? |
| Threats | What regulatory, economic, or competitive forces could make this idea unviable? |
4. Porter's Five Forces Framework
While tools like SWOT focus on internal strengths and weaknesses, Porter's Five Forces shifts the lens outward, examining the external market forces that shape your industry. This framework is essential for understanding the structural challenges and opportunities your startup might face. As Michael Porter, the creator of the model, explains:
"Industry structure, not company execution, is the primary determinant of long-run profitability." - Michael Porter, Professor, Harvard Business School [15]
The five forces include Competitive Rivalry, Threat of New Entrants, Threat of Substitutes, Bargaining Power of Suppliers, and Bargaining Power of Buyers. Together, they reveal whether your market offers room to grow or if it’s a battlefield where profits are squeezed thin. This external analysis complements internal evaluations like SWOT, giving you a fuller picture of your business environment and preparing you for the next steps in market validation.
One common mistake founders make is defining their industry too broadly. Labels like "AI" or "SaaS" are vague and unhelpful. Instead, narrow it down. For instance, instead of "AI", focus on "project management software for remote U.S. engineering teams." This specificity helps you map out your value chain - identifying suppliers (e.g., cloud providers or API services), distributors, and buyers. Once mapped, rate each force as High, Medium, or Low using concrete data like customer concentration ratios or switching costs. The goal? Pinpoint the dominant force in your market - the biggest threat to your margins - and tailor your entry strategy around it.
For U.S. startups, two forces often stand out. First, Supplier Power has evolved. Dependence on platforms like AWS, OpenAI, or Stripe means their pricing or policy changes can directly impact your bottom line. Second, the Threat of Substitutes is often underestimated. Sometimes, your biggest competitor isn’t another product but the customer’s decision to stick with the status quo. Ask yourself: What’s the cost to the customer of doing nothing for 90 days? If the answer is low, urgency will be a challenge, and sales cycles may drag on.
Here’s a quick breakdown of the five forces and their key questions:
| Force | Key Validation Question | Startup Red Flag |
|---|---|---|
| Competitive Rivalry | Can you answer "why you" without generic claims? | Price wars, undifferentiated products |
| New Entrants | What can a competitor replicate in 30 days? | Low capital or regulatory barriers |
| Substitutes | What would the customer do if your product disappeared? | Relying on spreadsheets or doing nothing |
| Supplier Power | What happens to your CAC if your primary platform changes its terms? | Single-vendor dependency |
| Buyer Power | Do deals only move when you drop the price? | A single customer represents 20%+ of ARR |
Once you’ve identified the dominant force, it’s time to act. Use a 45-day proof plan to test your assumptions and refine your strategy:
- Week 1–2: Interview potential customers about what would make them switch and their alternatives.
- Week 3–4: Test your approach in a focused segment to measure willingness-to-pay.
- Week 5–6: Experiment with features to see if they integrate seamlessly into customer workflows.
This structured approach helps you tackle market challenges head-on, giving your startup a better shot at success.
5. TAM, SAM, SOM Market Sizing Framework
Market sizing is all about quantifying the revenue potential of your business idea. Once you've analyzed your competition and business assumptions, the next big question is: Is the market big enough to support your venture? The TAM, SAM, SOM framework helps you move from vague optimism to solid, numbers-based projections.
Here’s how the three layers break down:
- TAM (Total Addressable Market): This is the total revenue opportunity if you could capture 100% of the market.
- SAM (Serviceable Addressable Market): This is the portion of the TAM you can realistically serve based on factors like geography, product features, and your business model.
- SOM (Serviceable Obtainable Market): This is the slice of the SAM you can realistically capture in the next 1–3 years, factoring in your current team, budget, and competition.
For startups, SOM usually falls between 0.5% and 2% of the TAM [18].
Relying solely on top-down market sizing - like quoting a massive industry figure - can hurt your credibility. Instead, a bottom-up approach is far more convincing. This means breaking down your market into specific, measurable components. For example, instead of saying, "We're targeting the $50 billion HR software market", you could say, "There are about 80,000 U.S. companies with 20–50 employees still using paper-based scheduling, and we plan to charge $5 per employee per month" [18]. This approach ties your assumptions to real data, making your projections more defensible.
Once you've outlined your TAM, SAM, and SOM, it's time to test those numbers with practical validation methods. For example, apply a Fermi Test: reverse-engineer your revenue goals. If you need 20,000 leads at a 1% conversion rate but there are only 3,000 potential customers, your model doesn’t hold up [17].
You can also validate demand by exploring complaints on platforms like Reddit, G2, and Capterra. If you find over 500 distinct mentions of a specific problem, it’s a strong sign of scalable demand [19].
"Product market fit means being in a good market with a product that can satisfy that market."
- Marc Andreessen, Co-founder, Andreessen Horowitz [16]
To refine your market sizing further, these tools can help:
| Tool | Use Case |
|---|---|
| Statista / IBISWorld | Use for top-down TAM benchmarks and industry revenue insights |
| Google Trends / Keyword Planner | Check search trends to confirm whether the market is growing or shrinking |
| BigIdeasDB | Analyze complaint frequencies to assess problem severity |
| TrustMRR | Access verified MRR data from over 2,700 startups to set realistic SOM targets |
Here’s a sobering statistic: 42% of startups fail because there’s no market need for their product [1][16]. Getting your market sizing right isn’t just about impressing investors - it’s about identifying potential deal-breakers before you spend months building something no one wants. This framework is a critical step to ensure your startup idea is on solid ground before you move forward.
6. Problem-Solution Fit and Customer Interview Framework
A huge market means nothing if the problem you're solving isn't real. This framework helps determine whether enough people genuinely face your target problem and are actively looking for a solution. It's a crucial checkpoint that separates a potential business from what some founders call an "expensive hobby" [2].
Before you start coding, talk to real people. But here's where many founders stumble - 78% of them ask leading questions that confirm their assumptions rather than uncover the truth [2]. The solution? Use the "Mom Test" approach. Instead of asking hypothetical questions, focus on past behavior. For example, ask, "Can you walk me through the last time you faced this issue?" People are honest about past actions, but hypothetical answers often mislead [2][21].
Aim to interview 15–20 people per customer segment. Why? By the 15th interview, you'll start seeing consistent patterns. Fewer than five interviews, though, only give anecdotal evidence [21]. To get useful insights, narrow down your Ideal Customer Profile (ICP). For instance, target "Shopify store owners making $10,000+ per month" instead of broadly targeting "small business owners." A broad audience leads to noisy, conflicting feedback that's hard to act on.
Pay attention to emotional language (words like "hate" or "frustrating") and signs of workaround solutions like spreadsheets or manual hacks. If people haven’t tried to solve the problem themselves, it’s likely not painful enough to build a business around [20][11]. Once you’ve validated the problem qualitatively, move to quantitative testing. For example, run a landing page with $100–$200 in ad spend. A conversion rate above 5% from cold traffic is a strong indicator of demand [22].
"'This sounds great, send me a link when it's ready' is the most expensive lie in startup history." - GoNoGo.team [21]
Verbal excitement alone isn’t enough. You need real commitment: a pre-order deposit, a credit card on file, or a signed Letter of Intent (LOI). Use this hierarchy to evaluate the strength of your evidence:
| Signal Type | Example | Strength |
|---|---|---|
| Weak | "That sounds interesting" or social media likes | Low |
| Medium | Email signup, waitlist join, or booked follow-up call | Moderate |
| Strong | Pre-order deposit, LOI, or credit card on file | High |
The 70% rule is a helpful benchmark: problem validation passes if at least 70% of your interviewees confirm the problem, face it at least weekly, and have already tried to solve it [13]. If you don’t hit this threshold, the problem isn’t severe enough - and no amount of clever design will fix that. This framework ensures you’re solving real pain points that drive genuine market demand.
7. Smoke Test and Fake Door Framework
Interviews can reveal a lot about what people say they’ll do, but the Smoke Test and Fake Door Framework focus on what they’ll actually do. A Smoke Test involves presenting an offer for a product that isn’t fully built yet, helping you gauge real demand. A Fake Door test takes it up a notch by adding a realistic "Buy Now" or "Get Started" button for a feature that doesn’t exist yet. This button measures user intent and turns assumptions into behavioral evidence [8].
Why does this matter? Because 42% of startups fail due to a lack of real market need [13]. These frameworks force you to confront a critical question before investing time and resources: When faced with a real price or signup, will people actually take action?
How to Run a 7-Day Validation Sprint [19]
Here’s a step-by-step guide to test your idea quickly and effectively:
-
Day 1: Start with a clear hypothesis. Use this template:
"We believe [niche] with [pain] will do [action] within [time window] because [value]. Success if [metric] is at or above [threshold]."
Make sure you set your success threshold upfront - don’t adjust it after seeing the results. -
Days 2–3: Create a simple landing page. Include a Stripe payment link to test if people are willing to pay, not just click.
-
Days 4–5: Drive traffic to your page. For B2B, try LinkedIn DMs or niche communities. For consumer products, consider Reddit or Google Ads with a modest budget of $50–$100.
-
Day 6: Analyze the data and conduct five short follow-up interviews. Focus on what people did, not just what they say they’ll do.
-
Day 7: Make your decision. Based on your pre-set threshold, decide whether to move forward or rethink your idea.
Why a Price Signal Matters
Adding a price signal early on is key. Even a small deposit - $5 or $20 - provides a much stronger indicator of real interest than a free signup [8]. To get meaningful results, aim for 150–300 qualified visitors to your landing page [8].
| Signup Rate | What It Tells You |
|---|---|
| 20%+ | Strong demand – move forward confidently |
| 10–20% | Decent interest – tweak your value proposition |
| 5–10% | Mixed results – dig deeper before committing |
| <5% | Weak interest – reevaluate your idea or audience |
If you fail to meet your target twice, it’s time to adjust your messaging or audience - not the product itself [8]. However, there’s an exception for regulated industries like fintech. In the U.S., 40% of fintech startups fail validation due to regulatory oversights [4]. Before testing with a landing page, run a regulatory smoke test - this could mean mock filings or consulting with compliance advisors.
"The real risk isn't moving slow. It's moving fast in the wrong direction." - Forest Technologies [24]
Once you’ve validated real user actions, you can focus on refining your unit economics and understanding your market dynamics.
8. Unit Economics and LTV:CAC Framework
Once you've confirmed that users are genuinely engaging with your product, the next big question is: Does your business make money from a single customer? This is where the Unit Economics and LTV:CAC framework comes into play, helping you evaluate customer profitability.
LTV (Customer Lifetime Value) represents the total gross profit - not revenue - you expect to earn from a customer over their entire relationship with your business. On the other hand, CAC (Customer Acquisition Cost) includes all expenses tied to acquiring that customer, such as advertising, sales salaries, CRM tools, and even the founder’s time spent on sales efforts [25]. A critical point: don’t calculate LTV using revenue. For instance, if a customer pays $100/month but costs $60/month to serve, the LTV should be based on the $40/month gross profit [25].
"If you cannot make money on one customer, scaling to one million customers will not fix the problem." - YourStory [26]
For SaaS businesses, a solid LTV:CAC ratio is 3:1, while a 5:1 ratio is considered outstanding. If your ratio is 1:1 or lower, you're losing money with each new customer. Even a 4:1 ratio might be concerning if it takes too long to recover your CAC.
The Importance of Payback Period
The payback period - the time it takes to recover your CAC - is just as important as the ratio itself. Here’s how the benchmarks stack up:
| Payback Period | Assessment | Implication |
|---|---|---|
| < 6 months | Amazing | Enables growth with minimal outside funding |
| 6–12 months | Healthy | Typical for venture-backed SaaS; sustainable |
| 12–18 months | Risky | Drains cash quickly; requires heavy funding |
| > 18 months | Deadly | High risk of running out of cash before profitability |
Calculating LTV and CAC
To apply this framework, use these formulas:
- LTV = (ARPU × Gross Margin %) / Churn Rate
- CAC = Total Sales and Marketing Expenses ÷ Number of New Customers
Why Churn Matters So Much
Reducing churn is one of the simplest ways to improve LTV. For example, cutting monthly churn from 5% to 3% increases the average customer lifetime from 20 months to 33 months - a 65% boost in LTV without acquiring a single new customer [25].
Tools to Track Metrics
Founders often use tools like:
- Stripe for billing data
- HubSpot or Salesforce for customer attribution
- Mixpanel or Amplitude for monitoring retention events
Lastly, segment your metrics by channel and customer type. Averages can hide which areas are actually driving profitability. Once your unit economics are solid, you're ready to assess the strategic risks outlined in the next framework.
9. Risk Matrix and Assumption Mapping Framework
Unit economics might confirm customer profitability, but they often leave critical assumptions unchecked. This framework highlights those untested beliefs.
Every startup operates on a foundation of assumptions - things like customer payment behavior, team capabilities, or regulatory approvals. The problem? Founders frequently treat these assumptions as facts. Assumption Mapping helps you separate what you know from what you think you know. As David J. Bland, Founder of Precoil, explains:
"Assumptions Mapping is a small but important tool... essential to testing business ideas that help replace guesswork, intuition, and best practices with knowledge." [27]
How the Matrix Works
This framework uses a 2×2 grid. The vertical axis measures how critical an assumption is (how disastrous it would be if proven wrong), while the horizontal axis measures the strength of evidence supporting it. You plot all your business assumptions on this grid, and the ones in the high-importance, low-evidence quadrant - often called the "Kill Zone" - demand immediate testing.
For startups in the U.S., these Kill Zone assumptions often involve regulatory requirements (e.g., HIPAA for healthtech or SEC compliance for fintech), scaling customer willingness to pay, or whether cold audiences will convert as effectively as initial warm networks. For example, customer acquisition costs can rise 2–5× when moving beyond friends and referrals [1].
This visual approach helps you focus on what matters most, setting the stage for smarter decision-making.
Applying It Step by Step
This method builds on earlier frameworks by pinpointing where deeper validation is required. Start by brainstorming 20–30 assumptions across three categories:
- Desirability (Do customers truly want this?)
- Viability (Will the economics work?)
- Feasibility (Can you deliver it legally and technically?)
Most startups uncover around 20–30 assumptions in these areas [29]. To reveal hidden risks, try this exercise: imagine your startup has failed a year from now and ask, "What went wrong?"
Once mapped, prioritize testing by calculating a Priority Score: Impact × Uncertainty × Speed of Testing. Focus on the riskiest assumptions first. As a team at Highline Beta put it:
"Too many teams jump to what's easiest to test, not what's riskiest to figure out. That's how you make fast progress in the wrong direction." [29]
For example, a B2B industrial firm identified 22 assumptions for a predictive maintenance tool. Three were flagged as "model-killers." Testing one assumption - whether IT teams would allow third-party data connections - revealed they wouldn’t, effectively invalidating the original model. This saved months of unnecessary work [30].
Matching Experiments to Risk Level
After prioritizing assumptions, design low-cost experiments to test them efficiently. Not every assumption demands an expensive approach. Here are a few options:
- Smoke tests: Use landing pages to gauge demand.
- Concierge tests: Manually deliver a service to validate its value.
- Wizard of Oz tests: Simulate automation by using manual processes to test technical feasibility.
These methods are often more affordable than traditional research, which can cost $10,000–$20,000 per phase - or even $40,000+ for niche qualitative studies [27]. Many effective experiments, like ad-based tests, can be run for as little as $0–$200 [28].
Review and refine your assumption map regularly - weekly standups are a great time to update it as new evidence comes in. Tools like InspectIdea help track risks across market, technology, regulation, and execution dimensions. Keeping your map dynamic ensures it evolves alongside your idea, working hand-in-hand with other methodologies to strengthen your startup's foundation.
10. Idea Scoring and Prioritization Framework
After validating your assumptions with earlier tools, this framework helps you determine whether to move forward, adjust your approach, or stop altogether.
It’s designed to counteract the natural biases founders often have. As Daniel Kahneman, author of Thinking, Fast and Slow, points out:
"The confidence that individuals have in their beliefs depends mostly on the quality of the story they can tell about what they see." [1]
In simpler terms, founders can become overly attached to their own narratives. A structured scoring system replaces this bias with evidence-based decisions. Like the earlier frameworks, this one turns qualitative feedback into a clear go/no-go decision.
How the Scoring Works
The framework uses a 5-Pillar Scoring Rubric, where you evaluate your idea across five dimensions: Problem, Market, Demand, Solution, and Business Model. Each pillar is scored from 1 to 5, with scores grounded in real evidence, not optimism. For example, a score of 5 in the Problem category means the issue is a daily, urgent pain point with clear workarounds already in use. A score of 1 indicates a problem that’s rarely encountered or ignored.
| Pillar | Score 5 (Pass) | Score 1 (Fail) |
|---|---|---|
| Problem | Daily "hair on fire" pain; actively paying for workarounds | Rarely experienced; no effort to solve |
| Market | $1B+ TAM; 20%+ YoY growth | <$1M TAM; declining market |
| Demand | 10%+ signup rate; 10+ pre-orders or LOIs | <1% signup rate; no action taken |
| Solution | Proven technology; with a sustainable competitive moat | Unproven technology; easily replicated |
| Biz Model | >5:1 LTV:CAC; 70%+ gross margin | <1:1 LTV:CAC; negative margins |
Once all five pillars are scored, the total determines your next steps. A score of 20–25 suggests you should move forward. Scores between 15–19 suggest a conditional go, focusing on improving weaker areas first. A score of 10–14 points to a pivot, while anything below 10 signals it’s time to stop [13].
This final scoring step acts as a decisive checkpoint, complementing earlier frameworks in evaluating your startup's viability.
Applying It in the U.S. Context
For founders in the U.S., two areas deserve extra scrutiny. First, regulatory risks, especially in industries like fintech, can’t be ignored. Compliance issues are a leading reason why 40% of startups fail validation in such sectors [4]. Make sure to assess this risk before jumping into development.
Second, focus on behavioral demand signals rather than verbal feedback. Instead of asking, “Would you pay for this?” take it a step further - include a Stripe payment link or a letter of intent (LOI) when pitching your idea. A verbal “yes” from a friend doesn’t hold much weight, but securing a pre-order speaks volumes.
To strengthen your evaluation, try the "Five-Conversation Rule": pitch your idea to five target customers and aim for commitments from at least two. If fewer than two people commit, consider it a signal to pivot or abandon the idea [5]. For landing page tests, a 3–5% click-to-pricing rate from qualified cold traffic is considered a strong early indicator [8].
This framework isn’t about proving your idea is flawless - it’s about identifying potential weak points. As Proof Engine puts it:
"Gut instinct is a terrible validation strategy. It feels right. It is fast. It is also wrong about 42% of the time." [13]
While gut instinct might feel quick and intuitive, it’s not reliable. Tools like InspectIdea offer a structured way to assess risks across areas like market conditions, competition, technology, execution, regulation, and finances. These tools help you document both your scores and evidence as you refine your idea.
Conclusion
Launching a startup without thoroughly stress-testing your idea is like opening a restaurant without ever tasting the food. The 10 frameworks we've discussed - from Lean Canvas to the Idea Scoring and Prioritization Framework - are designed to uncover weaknesses before the market does. Skipping this step isn’t just risky; it’s one of the leading causes of failure. In fact, 42% of startups fail because their product doesn’t meet market demand, and 92% don’t survive beyond three years [1][2].
"Validation means surfacing the structural gaps in an idea before the market does. It is a risk audit, not a confidence check." - ReadySetLaunch [3]
This discipline is especially critical in the U.S. market. By 2026, building software may be cheaper than ever thanks to AI, but acquiring customer attention is more expensive than it’s ever been [31]. The real challenge has shifted from “Can I build this?” to “Can I reach customers affordably enough to make the economics work?” Frameworks like TAM/SAM/SOM, Unit Economics, and the Smoke Test are designed to tackle this question before you invest in product development.
Think of these frameworks as a sequence rather than a simple checklist. Start with low-cost options like customer interviews or landing page tests, and only move to higher-fidelity experiments once your idea clears initial hurdles. Tools like InspectIdea can help you document your findings, track progress, and ensure you’re making data-driven decisions at every stage. This structured approach doesn’t just reduce risk - it also creates a smoother path to validation. As Louis Corneloup, Founder at Dupple, aptly puts it:
"The earlier you can kill a weak idea, the cheaper that lesson is." - Louis Corneloup, Founder at Dupple [4]
FAQs
::: faq
Which 1–2 frameworks should I start with?
When building something new, it’s crucial to start with the Problem-Solution Fit framework. This approach focuses on identifying a specific, pressing problem your target audience is experiencing - and making sure they’re actively looking for a solution. Without this alignment, even the most innovative ideas can fall flat.
Pair this with the Lean Startup framework, which emphasizes testing your ideas quickly using real customer feedback. This method allows you to refine your product or service based on what people actually need, helping you avoid wasting time, money, or effort on features that don’t resonate.
Together, these frameworks provide a strong foundation for creating something that genuinely solves your audience’s problems while ensuring your efforts are both efficient and effective. :::
::: faq
How do I know my customer interviews aren’t biased?
To keep customer interviews unbiased, avoid leading questions that might reinforce your assumptions. Instead, try the Mom Test method: ask about real past behaviors, current routines, and specific challenges rather than hypothetical situations. Stick to open-ended questions, such as asking about the last time they encountered a particular issue, and make sure to record their responses to evaluate their language and tone later. By separating the exploration of problems from testing potential solutions, you can minimize bias and gather insights you can act on. :::
::: faq
What metrics prove real demand before I build?
To make sure there's genuine demand before diving into development, focus on actions over opinions. Here's how:
- Talk to at least 15 potential customers. Look for people who rate the problem as a 7/10 or higher and are already spending money on temporary fixes. This shows they feel the pain and are actively trying to solve it.
- Create a behavioral landing page. If more than 5% of cold traffic converts, it’s a good sign there’s real interest.
- Get financial commitments. Pre-sales, deposits, or even credit card payments are the strongest indicators that people are serious about your solution.
These steps will help you validate demand before committing resources. :::